Unable to Proceed error during upgrade Operations Manager 2012R2

During the upgrade of Operations Manager 2012R2 it is possible that you encounter some problems. For example, starting the upgrade process for Operations Manager 2012 R2 the following error is shown in some cases: “Setup is unable to proceed with installation for the following reason: “Setup could not detect the current Data Warehouse scenario. Please ensure That the SQL Server service for the Data Warehouse is running, and the current User has permission to access the Data Warehouse” (Figure 1).


Figure 1. Operations Manager 2012R2 upgrade error: Unable to Proceed.

In such a case the names of the Data Warehouse Database and the Data Warehouse Database Server are missing in the registry and therefore the setup cannot be continued. To check this go to “HKEY_LOCAL_MACHINE \ SOFTWARE \ Microsoft \ Microsoft Operations Manager \ 3.0 \ Setup” to determine if the values of the “DataWarehouseDBName” and “DataWarehouseDBServerName” are present. If not, please add the Data Warehouse Database Name and Data Warehouse Server name as shown in Figure 2. Subsequently, restart the Operations Manager 2012R2 installation. The error should be resolved.

Figure 2: Data Warehouse Database name and the Data Warehouse Database Server name in registry.

Operations Manager Dashboards in Microsoft Visio

In this post I describe what cool items can be built with the Visio based dashboard solutions for System Center Operations Manager (SCOM).

I am aware of the awesome products that are made by Squared Up and Savision which both can be used to make excellent dashboards. However, in this post I will focus on the Microsoft Visio based solutions to create dashboards for Operations Manager environments for the simple reasons that it is low cost and the sky is the limit.

Currently, there are two solutions which are based on Microsoft Visio. The first one is the good old bad old Operations Manager Add-in for Visio by Microsoft, and the second one is Pro-View which is provided by OpsLogix. Both solutions offer the possibility to create awesome dashboards for Operations Manager. In this blog post I will describe the possible usage of both solutions and the basic steps to get started with these Visio additions. I will conclude this blog with my opinion on these Visio additions.

Why Dashboards?

Maybe the most important question to ask should be “why should we make use of dashboards?“  Operations Manager is a technical product, and that is a good thing but when making some nice distributed applications in Operations Manager, you probably want to publish them in a fancy way. In my opinion Visio is the right tool for the job, not only because it is possible to build exactly the dashboard you want but this can also be done at low cost. Besides that IT managers love it when they look at the nice overviews of their Business Applications.

Microsoft Operations Manager Visio Add-in and SharePoint Visio Services Data Provider

With the Microsoft Visio Add-in you can create beautiful diagrams that show monitored objects within your Operations Manager environment. For example, you can display complete business applications on a map in Visio including the health state. The Microsoft Visio Add-in comes with a SharePoint Visio Services data provider. This data provider enables you to publish the created Visio drawings in a SharePoint web part so you can include these in a SharePoint website. In such a case it is required to save the drawing with the *.vdw extension.

How it works?

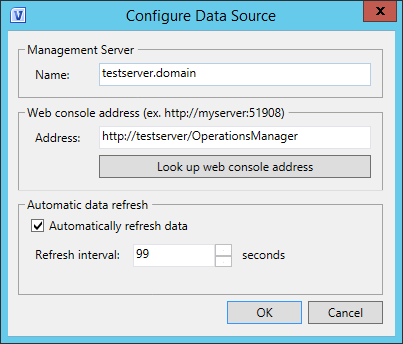
After installing the Visio Add-in, click here for the installation guide, we see that an extra tab is added to the Visio ribbon (Figure 1), named Operations Manager. Under the “Configure” button on the left, it is possible to configure the data source. The management server name and the address of the web console can be entered in this wizard (Figure 2). With these settings in place the connection to Operations Manager server can be made. You can also configure the refresh time of the dashboard so you will immediately see when the health state of objects change.

Figure 1. Operations Manager ribbon in Microsoft Visio.


Figure 2. Data source configuration.

Adding Visio Shapes

After the connection with Operations Manager has been made you can start creating dashboards. There are several ways to display shapes and objects on the Visio drawing. I will describe the different methods and how you can use them.

Method 1: Insert Shape

When clicking on the “Insert Shape” button, see Figure 1, you can add a shape to the drawing, Visio will add automatically the data links (Figure 3).


Figure 3. Add data links process bar.

It is possible to choose classes of objects that are managed in Operations Manager as shown in Figure 4.


Figure 4. Insert Shape, Choose class wizard.

When you select the object from the class you want to add, click “insert”. At this time the object has been added to your drawing (Figure 5).

Figure 5. Object has is added to the Visio drawing.

When selecting the shape use the right mouse button to select “Data” and subsequently select “Show Linked Row”. Now you will see the datalink in the External Data view. Here you will see the Object Id, Display Name, Path, Health State and Class name as shown in Figure 6.

Figure 6. External Data links Visio.

Method 2: Link Shape

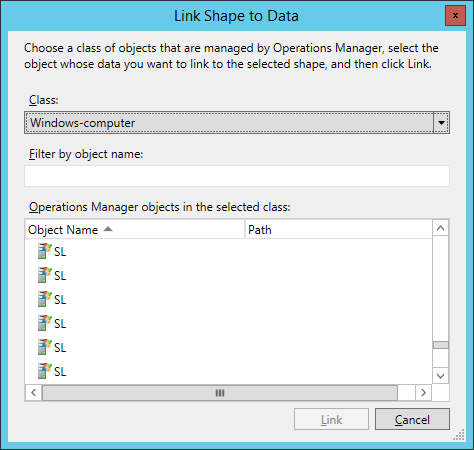
It is also possible to use the link shape method, when using this an existing shape on the drawing can be selected and subsequently linked to an object. Just drop a shape on the drawing and click on the “Link Shape” button in the ribbon as presented in Figure 1. In the pop-up window you can select the object from the class you want to add (Figure 7). After you click on “Link” you will see that the health icon has been added to the shape (Figure 8).


Figure 7. Link Shape to Data, choose class wizard.

Figure 8. Linked shape object on the Visio drawing.


Visio Data Graphic

A nice feature of Visio is that you can change the health Data Graphic of an object. Data graphics are in this situation used for classes, last refresh times and to show the health state of an object state amongst others. To change the data graphic select the shape then select “Data”, “Edit Data Graphic”. Now you can change for example the icon set as shown in Figure 9. It is possible to choose the default Operations Manager icon set or for instance traffic lights.


Figure 9. Edit the icon set for the health state of an object.

Adding refresh state

To ensure that the dashboard will continuously refresh its data, a state of the refresh time can be added to your dashboard. To do this, go to the Operations Manager ribbon (see Figure 1) and click on the ”Add Status” button. Now you will see that the refresh time of the dashboard is displayed on the drawing as presented in Figure 10.

Figure 10. Adding the state of the refresh time to the dashboard.

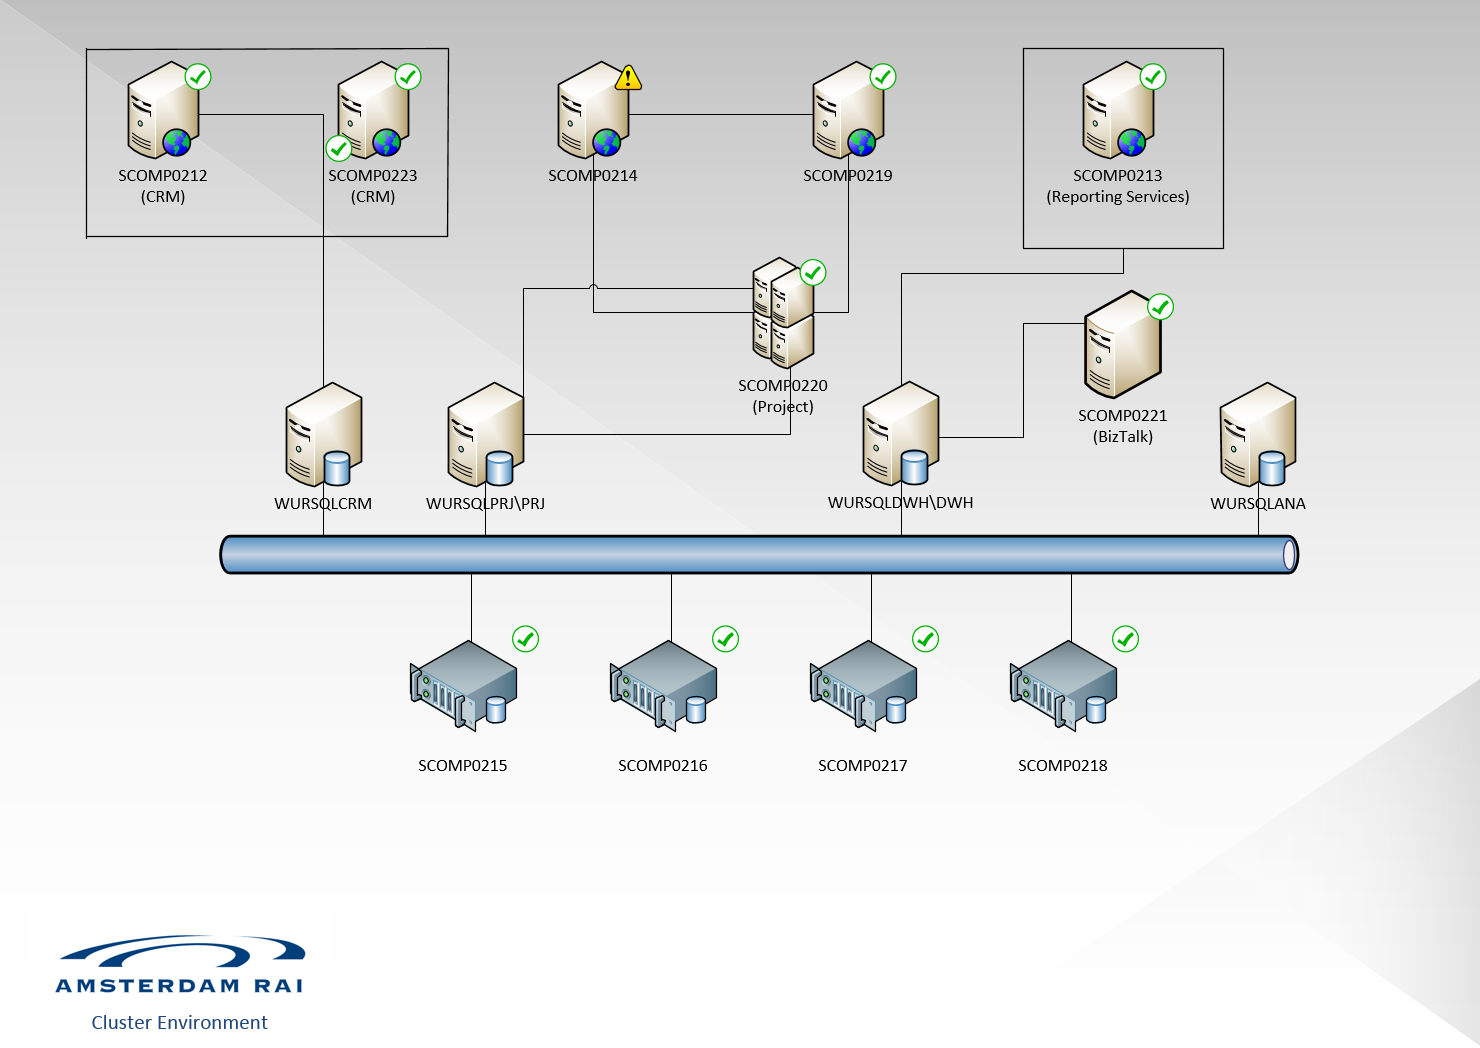
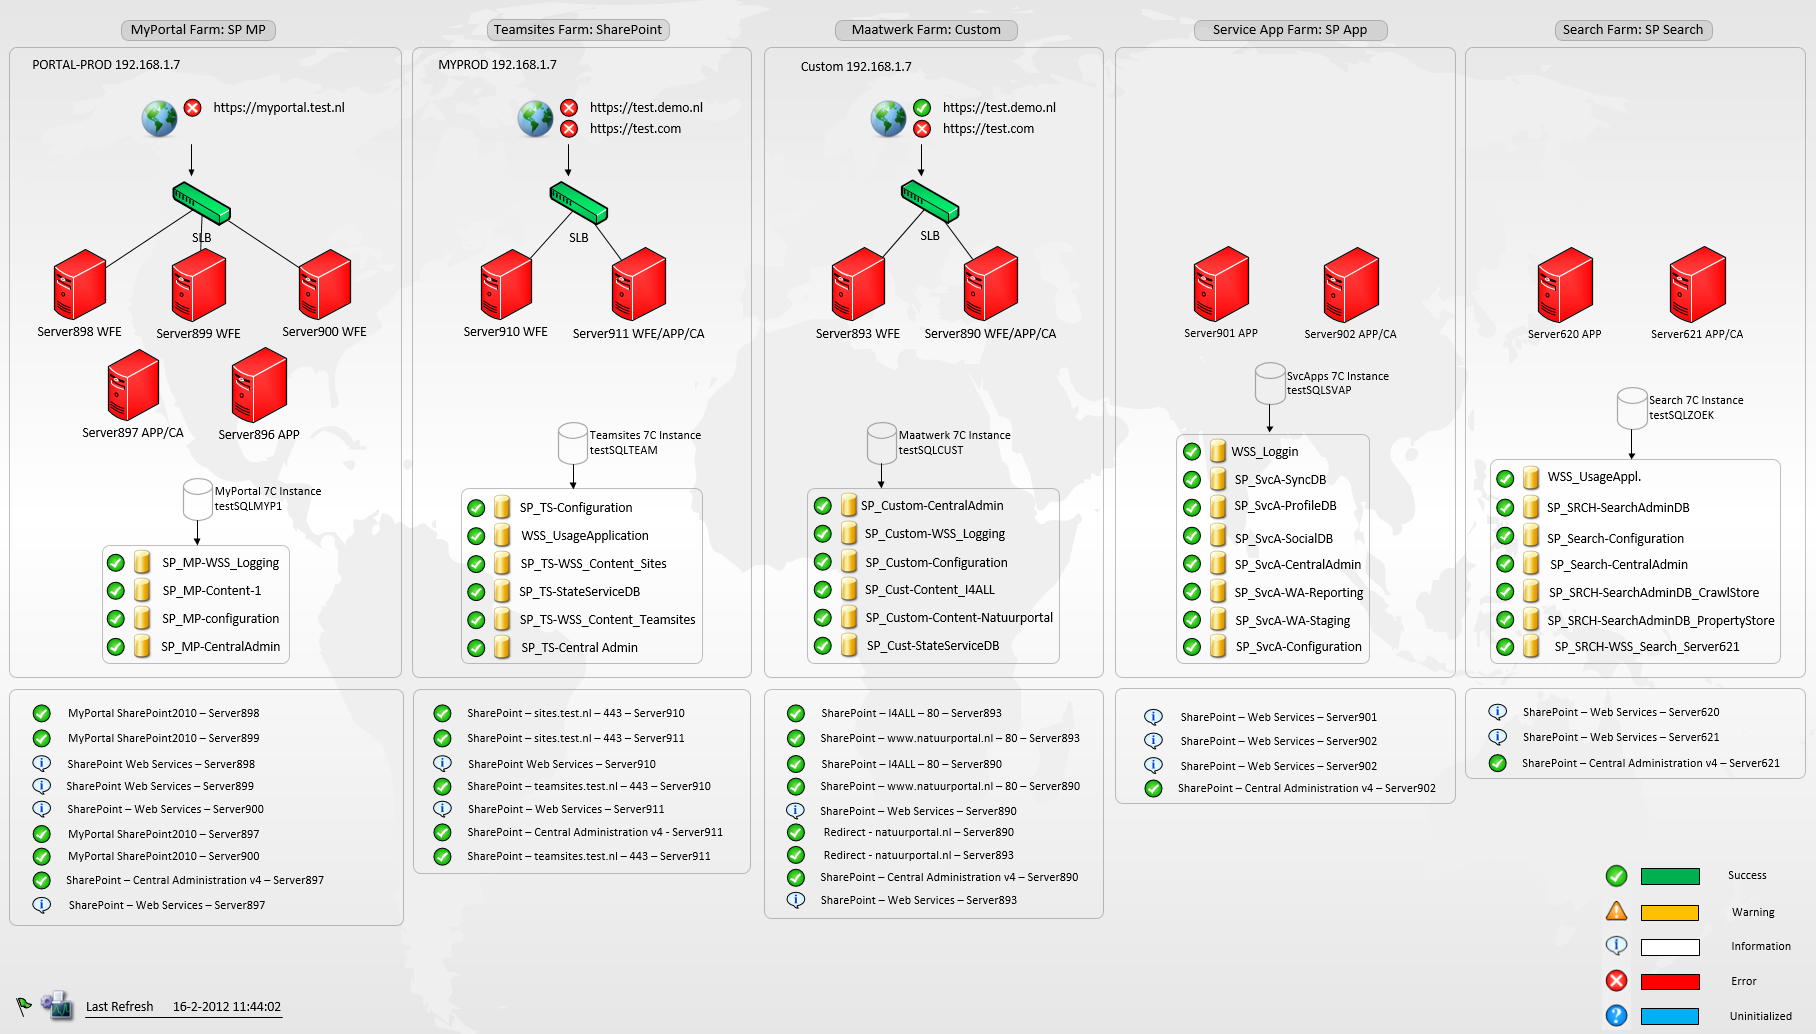
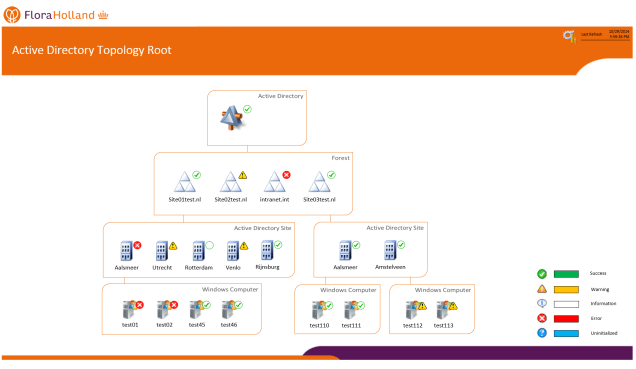
Below some examples of dashboards that I created using the Microsoft Visio Add-in are provided.


Resources

You can download the Operations Manager data module for Visio and the SharePoint data provider via the following link: http://www.microsoft.com/en-us/download/details.aspx?displaylang=en&id=29268

Microsoft has documented this Add-in very well, so installing it should not be a problem. Please see the following links for more information about how to install, configure, and use the Visio Add-in and the SharePoint 2010 Visio Services Data Provider.

Source: https://technet.microsoft.com/en-us/library/hh920821.aspx

OpsLogix ProView

The ProView solution made by OpsLogix is also an amazing tool to create dashboards. ProView is also an addition to Visio. This means that Visio is required to be used for building dashboards for Operations Manager.

ProView can minimally do the same thing as the Microsoft Visio Add-in. Thus, adding your own stencils and using these shapes is not an issue. ProView stands out with the ability to let you use performance counters. This means that you can get real-time insight in the performance of objects from Operations Manager such as databases, computers etc. Another very cool feature is that ProView dashboards are based on HTML 5, so you have the opportunity access the dashboards on any device. Therefore, it is not required to use SharePoint when publishing the dashboards.

How to create dashboards with Proview?

When ProView is installed, click here for the installation guide, the OpsLogix ProView tab will appear in the ribbon (Figure 11).

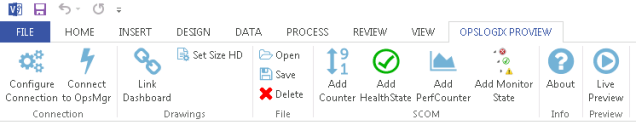
Figure 11. The ProView tab in the ribbon in Microsoft Visio.

First we have to configure the connection between ProView and Operations Manager as shown in Figure 12. Fill out the requested information and test the connection when you have done this click “Apply and Close”.


Figure 12. Configure the connection between ProView and Operations Manager.

If you intend to display the drawing on an HD screen you can directly adjust the size of the drawing with a press of a button to a 1080p format. To do this select “Set Size HD” in the ribbon (Figure 11).

Adding objects to the drawing

For ProView also applies that after the connection with Operations Manager has been made you can start creating dashboards. Just like the Visio Add-in from Microsoft you can add with ProView also different objects to the drawing. ProView allows you to use Alerts Counters, Health States, Performance Counters and Monitoring Add States objects. I will describe the features and basic usage of each of them.

Alert Counters

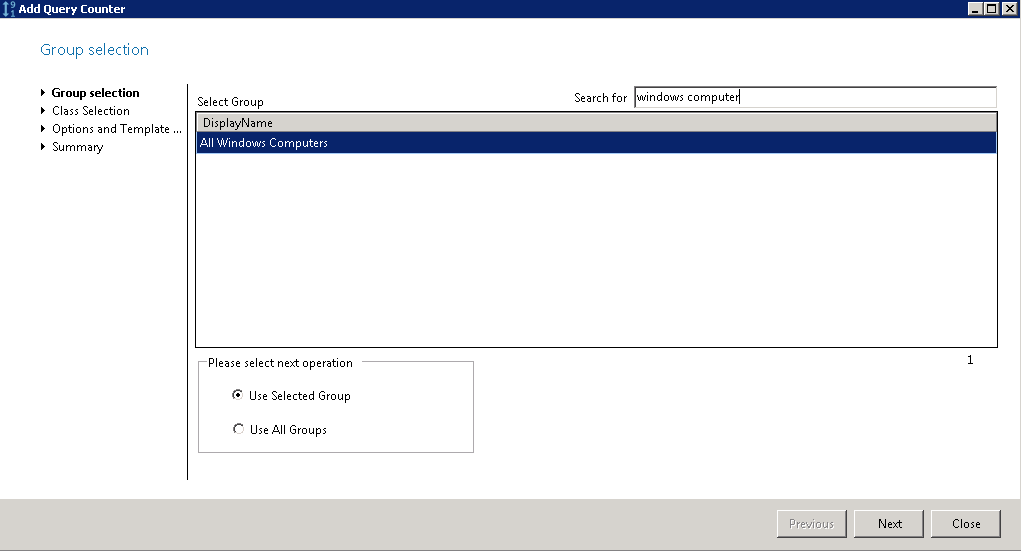
Alert counters can be used to get insight in the amount of alerts. With the “Add Counter” button you have the option to display all open alerts of a group. In this example we want to see all open alerts from the Windows Computer group. To accomplish this, select the first group as shown in Figure 13, and subsequently select the right Windows Computer class (Figure 14).

Figure 13. Group Selection, Select Group.


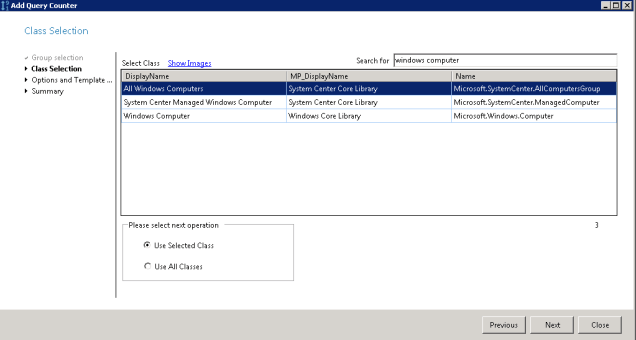
Figure 14. Class Selection, Select Class.

In the “Options and Template Management” screen, you can select an alert template as shown in Figure 15. There are many different flavors to choose from, for example “Show all active Critical Alerts” or “Show all Unhealthy Targets from SCOM”. By choosing an alert template it is possible to adjust the thresholds for the error and healthy state. Subsequently, it is possible to modify the colors of the health state (Figure 16), click “Next” and press “Add”.

Figure 15. Options and Template Management, Choose Template.

Figure 16. Options and Template Management, Pick the health state color.

Now the Alert Counter has been added to the Visio drawing (Figure 17). Selecting the Live Preview button in the ribbon as shown in Figure 11, you will get a preview of the dashboard including real time information from Operations Manager.

Figure 17. Adding Alert Counter on Visio drawing.

Health States

Health states can be used to gain more understanding of the health from particular objects. When you click on the “Add Health State” button in the ribbon (Figure 11) you have the option to add health states of objects. In the example presented logical disks were selected (Figure 18). On the “Target Selection” page select the instance you want to display (Figure 19).

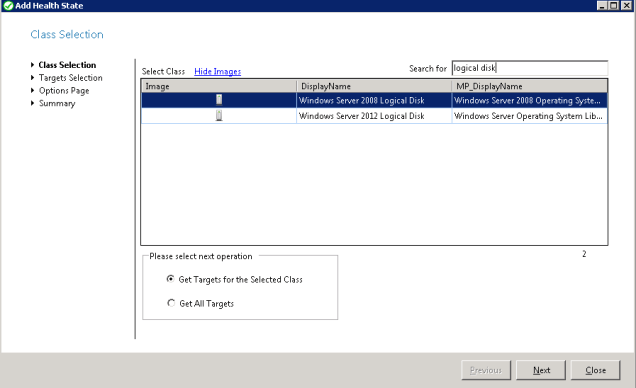
Figure 18. Class selection, Select Class.

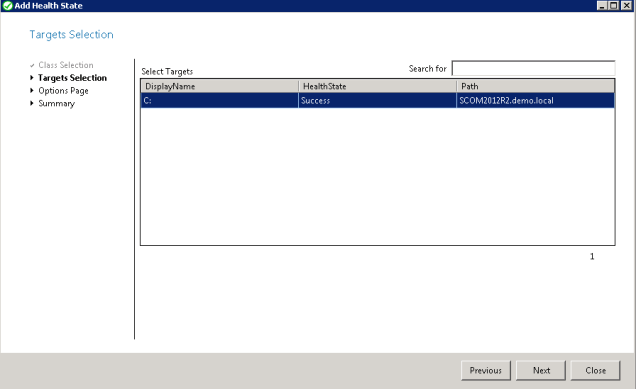
Figure 19. Target selection, Select Target.

On the “Options Page” you can select how you want to display the health state (Figure 20). You can choose between 1) an icon that will change its color and 2) the icon with a health state in the right corner. Click “Next” and press “Add” on the summary page, now the object will appear on the dashboard (Figure 21).

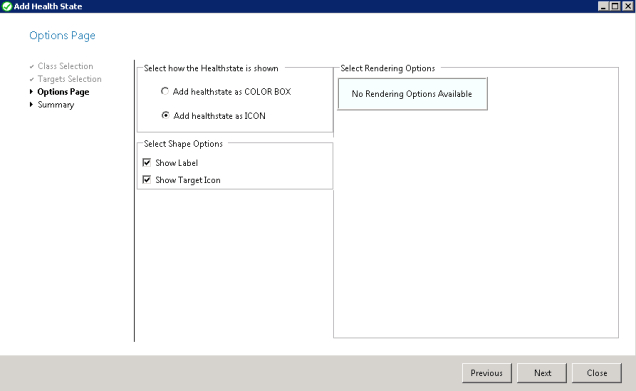
Figure 20. Options Page, Select how the health state is shown.

Figure 21. Logical Disk object with health state icon.

Performance Counters

The use performance counters will give you more insight in the performance of the selected object trough dynamic data graphics. To add performance counters to the dashboard use the “Add PerfCounter” button in the ribbon as presented in Figure 11. On the first page of the wizard, entitled “Target Selection”, you can select an instance (Figure 22). On the next page you can select the performance counter of preference (Figure 23).

Figure 22. Target Selection, Select Target.

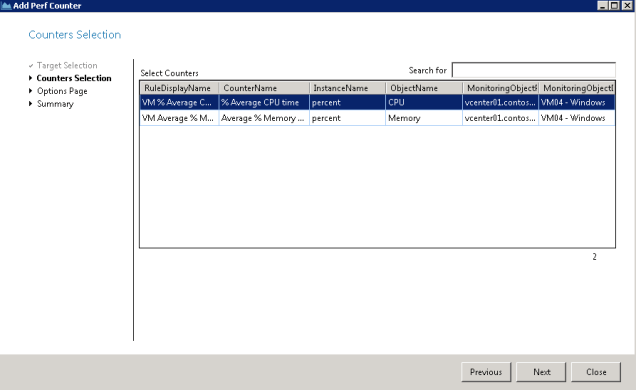
Figure 23. Counter Selection, Select Counters.

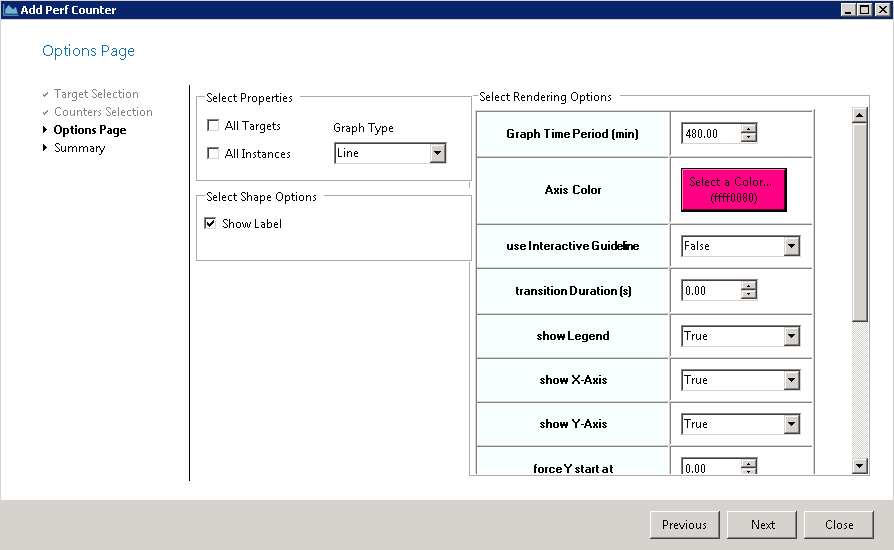
Click “Next” to go to the options page. On this page (Figure 24) you can configure several items like which data graphic you want to use and how you want to render. There are different Graphic Types such as Line, Sparkline, Bar, Bullet, Pie and Zoomline to choose from.

Select “All Targets” if you want to include also the performance counter data from all other targets of the same target class you selected before. Otherwise choose “All Instances” when you want to include the performance counter data from all the instances that belong to the selected target. In this example I want to see the average CPU time of one target, so I leave both options unselected. Define all remaining settings and press “Next”, then press “Add” to add the performance counter to the drawing (Figure 25).

Figure 24. Options Page, Select Properties.

Figure 25. Adding Performance Counter to the Visio drawing.

Add Monitoring State

Through this wizard you can add the health state of a monitor to the dashboard. The health state gives insight in the different monitors that are configured in Operations Manager. This is very useful in case you want to see the availability of the defragmentation state instead of the whole disk. Click on the “Add Monitor State” button in the ribbon (Figure 11). In the add monitor state wizard select the class you want to use. In the present example I choose the Windows Computer class (Figure 26).

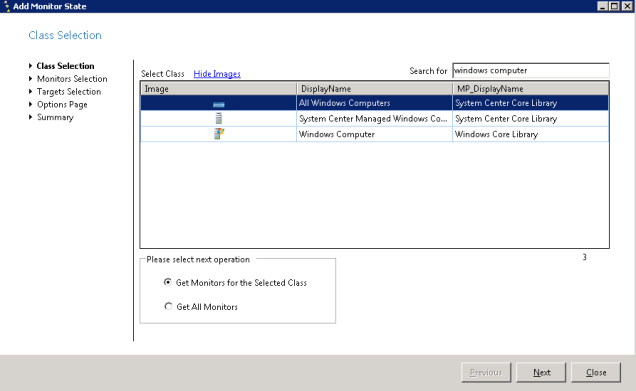
Figure 26. Class Selection, Select Class.

On the Monitor Selection page select the correct monitor and click “Next” (Figure 27).

Figure 27. Monitors Selection, Select Monitors.

Subsequently, select the target you want to use as demonstrated in Figure 28.

Figure 28. Target Selection, Select Targets.

On the option page you can choose for a health state as a color box or icon. In this example I choose the color box (Figure 29). On the summary page click “Add” to add the monitor to the dashboard (Figure 30).

Figure 29. Options Page, Select how the health state is shown.

Figure 30. Add Monitor State as a color box to the drawing.

Dashboard Preview

Unlike the Microsoft Visio Add-in, ProView does not have the ability to display live data on the dashboard at the moment you are working on it. To see the live data from the dashboard press the “Live PreView” button in the ribbon (Figure 11).

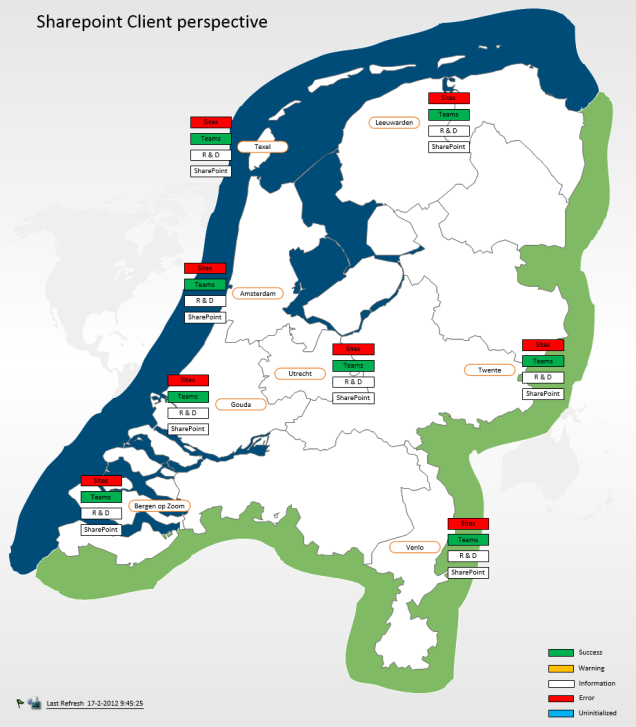
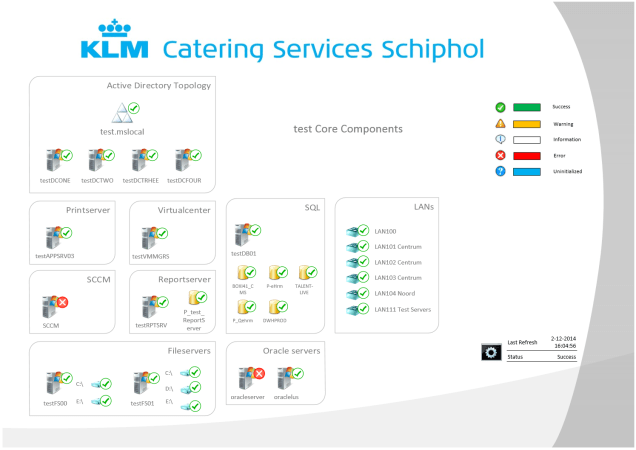
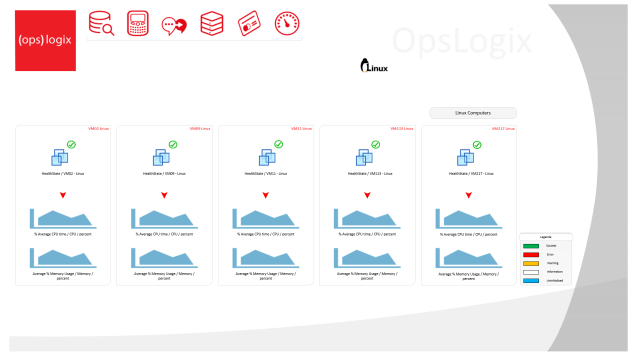
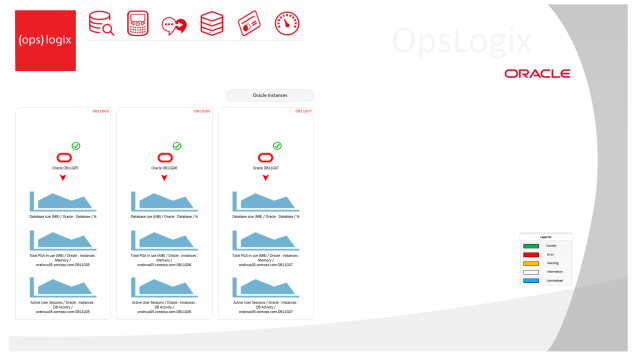
Below some examples are presented of dashboards that I created using OpsLogix Proview.


Resources

For more information about the OpsLogix Proview Visio plug-in please see: http://www.opslogix.com/proview/

OpsLogix made some nice getting started videos. Please see the following links for more information about how to install, configure, and use ProView.

Conclusion

Both Visio solutions described in this blog post can be used to create fantastic dashboards for Operations Manager! However, each Visio solution has its own advantages and disadvantages.

The possibilities with the Microsoft Visio Add-in are almost endless. An advantage is that the Microsoft Visio Add-in is free of cost. One of the drawbacks is that the Microsoft Visio Add-in does not support HTML 5 and this is where ProView stands out. Resulting from the fact that ProView is HTML 5 based and the dashboards can be accessed from different locations and devices. ProView allows you to create dashboards in Visio and store these in a management pack, so the dashboards are also visible in the Operations Console. Additionally, when using ProView it is possible to add performance counters of objects to the drawing, so it provides insight in the performance of the managed objects.

ProView also works via a wizard that can be used to add and edit the image or icon of grouped/individual counters including perfmon, health and/or monitor states. Publishing the dashboards in ProView does not require SharePoint or Silverlight. The Microsoft Add-in needs SharePoint if the dashboards will be published on a central location.

Despite the disadvantage of not supporting HTML 5, the Microsoft Visio Add-in is very easy to install and use especially if you use the Visio stencils available for Operations Manager. In fact, the installation of the Microsoft Visio Add-in is less complex compared to that of OpsLogix ProView. Of course it should be noted that the dashboards created in ProView cannot only be published using Visio or SharePoint but also from the Operations Manager console which is considered an advantage over Microsoft Visio Add-in. For this reason the installation of ProView is more complex and consequently also more time consuming.

Microsoft Visio Add-in offers the opportunity to link multiple tabs in the same Visio file. This is especially very convenient when one wants to zoom in on an object presented on the dashboard. ProView offers approximately the same functionalities. However, resulting from the use of *.svg as a file extension every tab should be saved as a separate file in ProView.

It is difficult to indicate which of the two Visio solutions I prefer since both solutions make it possible to create excellent dashboards. The use of both solutions of course requires some knowledge on Visio. Considering that the Microsoft Visio Add-in is free of charge and that it can easily be installed and used, I slightly prefer this Visio solution. To be honest ProView has just entered the world of Operations Manager dashboarding, so I expect that many more cool features will be added in the future. ProView is certainly a product to keep an eye on.

 Be Creative

In this blogpost I describe the basics of both the Microsoft Add-in and Oplogix Proview. As it is expressed beautifully on the OpsLogix website:

You are the artist and you can control everything

Thus, apply your own creativity when making overview dashboards of the infrastructure or the application environment of organizations. I hope I have provided an insight in the possibilities of both Visio solutions and that it will inspire you to start with one of these fantastic products. Please also see the webinar from Pete Zeger on dashboarding in System Center were some of my dashboards are shown: https://www.youtube.com/watch?v=NuMAUKEDkx0&feature=youtu.be

SCOM License: Requested registry access is not allowed

After installing System Center Operations Manager (SCOM) 2012 R2 it is necessary to enter the product key. This can be done by the Operations Manager Shell, but if the command Set-SCOMLicense -ProductId <Product Key> was entered the message: set-scomlicense: Requested registry access is not allowed may appear (Figure 1).

Figure 1. SCOM PowerShell License key error


To rapidly add the Operations Manager product key the following steps should be taken:

Solution:

  1. Open the standard Windows PowerShell console as an Administrator.
  2. Type the following command: Import-Module OperationsManager
  3. Enter the following command: Set-SCOMLicense -ProductId <Product Key>

This way you can quickly activate Operations Manager without editing the registry settings. Don’t forget to restart the Operations Manager server.

I found this solution on Michael Skov’s his blog, which can be found here. Many thanks Michael for sharing this solution.

Creating Rules in Operations Manager 2012 R2

In this post I will describe the necessary steps that must be followed in order to create a rule targeted against a group in Operations Manager (OpsMgr) 2012 R2. In this particular case I will create a rule that keeps an eye on the Windows Special Logon events. The procedure is as follows:

Open the Operations Manager console -> Authoring -> Management Pack Objects. Right click on Rules -> Create a new rule. Open the Alert Generating Rules -> Event Based and select NT Event Log (Alert) (Figure 1).

Figure 1. Create Rule Wizard, Rule Type.

Select also the proper destination Management Pack (Figure 1) and click Next.

In the General window fill out the name of the rule. Optionally a description can be given as presented in Figure 2.

Select Alert as the Rule Category (Figure 2).

The Rule Target must be Windows Computer (Figure 2).

Make sure to uncheck the box Rule is enabled and click Next (Figure 2).

Figure 2. Create Rule Wizard, General.

Select the security event log and click Next (Figure 3).

Figure 3. Create Rule Wizard, Event Log Type.

In the build event Expression window fill out Event ID as the Parameter Name, Equals as the Operator choose a Value of 4672 and click Next (Figure 4).


Figure 4. Create Rule Wizard, Build Event Expression.

Fill out the Alert name and Alert description. Subsequently, select the priority and severity. In this case I chose to put the severity on the Information level. Next, click on Create (Figure 5). Optionally, custom alert fields can be added to the Alert description. Moreover, it is possible to make use of alert suppression.

Figure 5. Create Rule Wizard, Configure Alerts.


When the rule is created, search for it in the Look for box and open the rule properties (Figure 6).

Figure 6. Search rules.


In the rule properties window select the Overrides tab and select Override… For a group… (Figure 7).


Figure 7. Override for a group window.

Search and select the proper group and click OK.

*Make sure that the selected group is located in the same management pack as the rule. An alternative is to make use of a group that is located in a sealed management pack.

In the Override-controlled parameters check Enabled and make sure that the Override Value is set on True (Figure 8).

Figure 8. Override Properties window.

Figure 9 shows the alert properties in case an account with special logon has been reported. If desired it is possible to create a dedicated alert view to collect all the alerts (Figure 10).


Figure 9. Alert properties, special logon event.


Figure 10. Alert view, special logon events.

Good luck when practicing this kind of cool stuff in your own lab environment.

Application Performance Monitoring – Client-Side Monitoring

Introduction

In my previous post I described the configuration of Application Performance Monitoring (APM) for SharePoint 2010, including Client-Side Monitoring (CSM) for SharePoint. Unfortunately, CSM is not supported for SharePoint 2010 and the configuration of CSM as described in my previous post was found to give disappointing results. Therefore, I will describe the setup of CSM monitoring for .Net Applications in this post.

The prerequisites

First it needs to be checked if the correct Management Packs (MP) are installed as shown in Figure 1.

Figure 1. Required Management Packs for APM.

It is of importance that Server-Side Configuration for the .Net application has been configured properly, as described in my previous post: Application Performance Monitoring – SharePoint 2010.

Another prerequisite for configuring CSM is that the .Net application should be compatible for monitoring. To check if the .Net application is indeed compatible go to the IIS Web Application Inventory and select the .Net application of preference as illustrated in Figure 2.

Figure 2. IIS Web Application Inventory view.

Next, “Check Client-Side Monitoring Compatibility” should be selected in the task menu (Figure 3).


Figure 3. Task to start CSM compatibility.

This task verifies if the .Net application can be safely monitored by using CSM. Click “Run” to start the task (Figure 4).


Figure 4. Run task check CSM compatibility.

Read and verify the task output and check if it is safe to use CSM for the .Net application as shown in Figure 5.

Figure 5. Task status check CSM compatibility.

Configuring CSM

In order to configure CSM, the properties of the application that are already configured for Server Side Monitoring should be opened first: go to Authoring → select .Net Application Performance Monitoring and open the properties of the .Net application. Next, the tab “Client Side Monitoring” can be selected as shown in Figure 6. Make sure that the check box is enabled. Subsequently, a group can be selected with servers as the Targeted group.


Figure 6. General properties, CSM tab.

Select Customize to adjust the client-side configuration. Figure 7 presents several configuration settings such as turning on performance and exception alerts, page load thresholds, and sensitivity thresholds. It is of foremost importance to configure the client IP address filter properly. Please note that only localhost addresses are monitored by default. This means that all IP addresses are monitored in case no IP addresses are added to the IP filter list. The IP addresses added to the IP filter list are excluded from CSM.

Figure 7. Modifying CSM settings.

Once CSM has been configured for the preferred .Net application it can be checked whether the configuration was successful.  This can be done via the browser. If the .Net application is loaded, hit F12 to open the developer mode and search for a code similar to the one presented in Figure 8. When such a code is presented it can be assumed that CSM has been successfully applied to the .Net application. In the state view of the monitored .Net application it can be seen that the “Client-Side Monitoring Application Component“ has received a healthy status as demonstrated in Figure 9.

Figure 8. Internet Explorer developer mode.

Figure 9. State view of the APM monitored application.


Application Performance Monitoring – SharePoint 2010

Introduction

The last couple of weeks I was working for a customer to configure .NET Application Performance Monitoring (APM). One of the applications that they want to monitor is SharePoint 2010. In this blog post I will guide you through the configuration steps. Although this post is focused on SharePoint 2010, the Server Side configuration steps can also be used for configuring other .NET applications. The reason that the focus lies on the Server-Side configuration rather than the Client-Side configuration, is that for SharePoint 2010 Client-Side monitoring is not supported. Below I describe these issues and my findings. 

The prerequisites

Firstly, it needs to be checked if AviCode is still available on the servers that need to be configured. It is not possible to have both AviCode and APM Agents on the same IIS server. Thus, in case an AviCode agent is installed, please remove the AviCode agent prior to starting the APM configuration. For more information see https://technet.microsoft.com/en-us/library/hh543998.aspx

Secondly, it needs to be checked if the correct Management Packs (MP) are installed in Operations Manager. Figure 1 presents the MP’s that need to be imported in order to avoid warnings during the configuration of APM.

Figure 1. Required Management Packs for APM

Configuration Server-Side

When opening the Operations Manager console go to Authoring Add Monitoring Wizard. In the “Monitoring Type” screen select .Net Application Performance Monitoring (Figure 2) and click Next.

Figure 2. Monitoring Type, APM configuration wizard.

Figure 3 gives an overview of the general properties in the APM configuration wizard. Here it is possible to fill in the application name. In this case the name “SharePoint 2010” was used. Next, the destination of the MP can be selected. It is recommended to save your APM configuration in a new MP. Click Next to continue.

Figure 3. General Properties, APM configuration wizard.

In the “What To Monitor” screen that will appear it is possible to select the application components. This can be done by clicking the Add… button (Figure 4).


Figure 4. Object Search window, APM configuration wizard.

Once the selected application components are added click OK. The “What To Monitor” screen also provides the ability to select the environment, in our case this is Production. Subsequently, a group can be selected with our SharePoint 2010 production servers as the Targeted group (Figure 5).

*The environment name will be displayed behind the application name with a dash. So the name in our case will be “SharePoint 2010 – Production”.

Figure 5. What to Monitor window, APM configuration wizard.

In the Server-Side Configuration window it is possible to select event alerts (Figure 6). In the present case both performance and exception alerts are selected. The performance threshold were kept on default (i.e. 15 seconds).

Figure 6. Server-Side Configuration window, APM configuration wizard.

If preferred, one can select the Advanced Settings enabling a more in dept configuration of the events (Figure 7). For example, the threshold can be tuned. This can also be done for performance events when the maximum number of events exceeds the threshold including the interval in seconds, minutes and hours. An average request time threshold can also be set. In addition to this configuration it is also possible to select the alerts one wants to see (e.g. security, connectivity and application failure alerts). Once these settings are complete, click OK, then Next and Create.

Figure 7. Advanced settings Configuration window, APM configuration wizard.

*Please note that for APM an IIS restart is required in order to function properly.

Checking if APM works

Just to be sure it can be checked if the System Center Management APM service has started correctly on the related servers. If everything is configured properly, this service will start automatically (Figure 8).

Figure 8. Services. MSc on the server, to check if the System Center Management APM service has been started.

Now the Operations Manager console needs to be checked to determine if the correct data is presented. For this purpose, go to the Monitoring Pane and open the folder Application Monitoring .Net Monitoring and in the current case → SharePoint 2010 – Production. The State View can now be selected (Figure 9). Moreover, some incoming alerts can even been seen as presented in Figure 10.


Figure 9. State view APM ASP.NET Web Application Component.

Figure 10. Alert view APM ASP.NET Web Application Component.

Configuration Client-Side

*Please note that the configuration of client-side as described below was found to give disappointing results. I will configure client-side-monitoring for other IIS applications in another post.

Before configuring the client side monitoring for SharePoint 2010, a check needs to be performed to determine if the application is ready for this functionality. We can monitor the end-user experience with this feature. First the task needs to be run to check the compatibility of the website. This task can be run from the IIS 7.0 ASP.NET Web Application Inventory or IIS 7.0 ASP.NET Web Application Inventory when an II 8.0 website is concerned (Figure 11 and 12).


Figure 11. IIS 7.0 and 8.0 ASP.NET Web Application Inventory view.


Figure 12. Task to check whet either the IIS application is ready for client-side monitoring.

Next, click Run to start the actual compatibility check and wait for the results (Figure 13).


Figure 13. Task to check whet either the IIS application is ready for client-side monitoring.

Unfortunetly, the output for the SharePoint client side compatibility test, were as follows:

Compatibility check result: Critical incompatibility. Severe incompatibilities were found in application files.

Taking a closer look at the incompatibility resources, it seemed that a lot of errors were related to default SharePoint files. The complete output was over 39 pages. Below some errors that were obtained are presented (Figure 14).

Figure 14. Output client-side monitoring compatibility task.

.dll assembly file: C:\Program Files\Common Files\Microsoft Shared\Web Server Extensions\14\isapi\Microsoft.Office.Server.dll – Method reference name: Flush. .dll assembly file: C:\Program Files\Common Files\Microsoft Shared\Web Server Extensions\14\isapi\Microsoft.SharePoint.dll – Method reference name: Flush. .dll assembly file: C:\Program Files\Common Files\Microsoft Shared\Web Server Extensions\14\isapi\microsoft.sharepoint.portal.dll – Method reference name: Flush.

.aspx file: C:\Program Files\Common Files\Microsoft Shared\Web Server Extensions\14\template\layouts\sledit.aspx – Line: 113, Character: 1. .aspx file: C:\Program Files\Common Files\Microsoft Shared\Web Server Extensions\14\template\layouts\slnew.aspx – Line: 90, Character: 1. .aspx file: C:\Program Files\Common Files\Microsoft Shared\Web Server Extensions\14\template\layouts\viewedit.aspx – Line: 602, Character: 1. .ascx file: C:\Program Files\Common Files\Microsoft Shared\Web Server Extensions\14\template\controltemplates\sldlibtemplates.ascx – Line: 88, Character: 1.

.dll assembly file: C:\Program Files\Common Files\Microsoft Shared\Web Server Extensions\14\isapi\Microsoft.SharePoint.dll – Method reference name: WriteSubstitution. .dll assembly file: C:\Program Files\Common Files\Microsoft Shared\Web Server Extensions\14\isapi\Microsoft.SharePoint.dll – Method reference name: .ctor.

Because there were a lot of incompatibility errors with SharePoint’s default dll’s,Microsoft was asked to take a look at this and comment on our findings. Microsoft came back with the following answer:

Client-side.NET Application Performance Monitoring (APM) is not supported for SharePoint. Enabling client-side .NET Application Performance Monitoring for SharePoint can result in unpredictable application behavior and failures.

https://technet.microsoft.com/en-us/library/jj614617.aspx

It seems to be that Microsoft does not support Client-Side Monitoring for SharePoint 2010 in Operations Manager 2012 SP1 and Operations Manager 2012 R2 at all.

Additionally, Microsoft also indicated that they do not support SharePoint 2013 for Application Performance Monitoring. Moreover, they also indicated that there are no plans for now to make this happen in the (near) future, so that’s pity…

In the end we can still make use of Web Application Transaction monitoring and Web Applications Availability Monitoring. However, it does not provide the end-user experience and troubleshooting possibilities that we want from client-side monitoring.

I will write another post soon about client side monitoring that works without SharePoint! In that post I will also describe how you can check that it actually works!