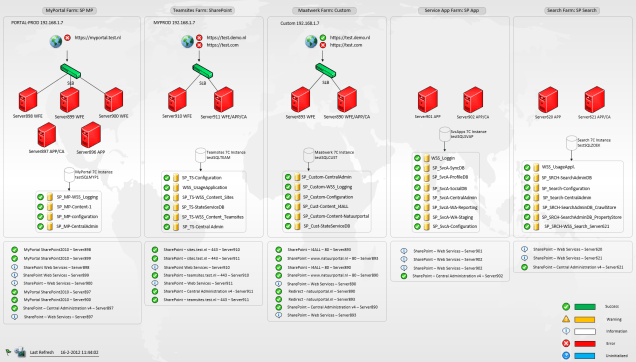
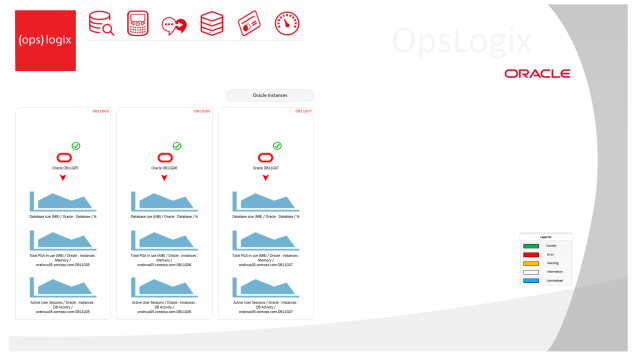
In this post I describe what cool items can be built with the Visio based dashboard solutions for System Center Operations Manager (SCOM).
I am aware of the awesome products that are made by Squared Up and Savision which both can be used to make excellent dashboards. However, in this post I will focus on the Microsoft Visio based solutions to create dashboards for Operations Manager environments for the simple reasons that it is low cost and the sky is the limit.
Currently, there are two solutions which are based on Microsoft Visio. The first one is the good old bad old Operations Manager Add-in for Visio by Microsoft, and the second one is Pro-View which is provided by OpsLogix. Both solutions offer the possibility to create awesome dashboards for Operations Manager. In this blog post I will describe the possible usage of both solutions and the basic steps to get started with these Visio additions. I will conclude this blog with my opinion on these Visio additions.
Why Dashboards?
Maybe the most important question to ask should be “why should we make use of dashboards?“ Operations Manager is a technical product, and that is a good thing but when making some nice distributed applications in Operations Manager, you probably want to publish them in a fancy way. In my opinion Visio is the right tool for the job, not only because it is possible to build exactly the dashboard you want but this can also be done at low cost. Besides that IT managers love it when they look at the nice overviews of their Business Applications.
Microsoft Operations Manager Visio Add-in and SharePoint Visio Services Data Provider
With the Microsoft Visio Add-in you can create beautiful diagrams that show monitored objects within your Operations Manager environment. For example, you can display complete business applications on a map in Visio including the health state. The Microsoft Visio Add-in comes with a SharePoint Visio Services data provider. This data provider enables you to publish the created Visio drawings in a SharePoint web part so you can include these in a SharePoint website. In such a case it is required to save the drawing with the *.vdw extension.
How it works?
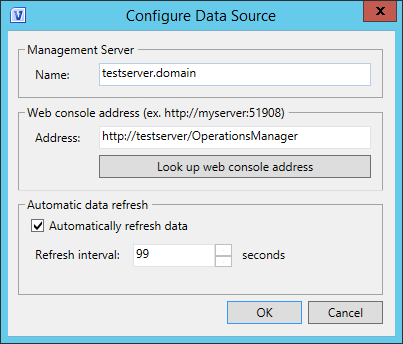
After installing the Visio Add-in, click here for the installation guide, we see that an extra tab is added to the Visio ribbon (Figure 1), named Operations Manager. Under the “Configure” button on the left, it is possible to configure the data source. The management server name and the address of the web console can be entered in this wizard (Figure 2). With these settings in place the connection to Operations Manager server can be made. You can also configure the refresh time of the dashboard so you will immediately see when the health state of objects change.
Figure 1. Operations Manager ribbon in Microsoft Visio.
Figure 2. Data source configuration.
Adding Visio Shapes
After the connection with Operations Manager has been made you can start creating dashboards. There are several ways to display shapes and objects on the Visio drawing. I will describe the different methods and how you can use them.
Method 1: Insert Shape
When clicking on the “Insert Shape” button, see Figure 1, you can add a shape to the drawing, Visio will add automatically the data links (Figure 3).
Figure 3. Add data links process bar.
It is possible to choose classes of objects that are managed in Operations Manager as shown in Figure 4.
Figure 4. Insert Shape, Choose class wizard.
When you select the object from the class you want to add, click “insert”. At this time the object has been added to your drawing (Figure 5).
Figure 5. Object has is added to the Visio drawing.
When selecting the shape use the right mouse button to select “Data” and subsequently select “Show Linked Row”. Now you will see the datalink in the External Data view. Here you will see the Object Id, Display Name, Path, Health State and Class name as shown in Figure 6.
Figure 6. External Data links Visio.
Method 2: Link Shape
It is also possible to use the link shape method, when using this an existing shape on the drawing can be selected and subsequently linked to an object. Just drop a shape on the drawing and click on the “Link Shape” button in the ribbon as presented in Figure 1. In the pop-up window you can select the object from the class you want to add (Figure 7). After you click on “Link” you will see that the health icon has been added to the shape (Figure 8).
Figure 7. Link Shape to Data, choose class wizard.
 Figure 8. Linked shape object on the Visio drawing.
Visio Data Graphic
A nice feature of Visio is that you can change the health Data Graphic of an object. Data graphics are in this situation used for classes, last refresh times and to show the health state of an object state amongst others. To change the data graphic select the shape then select “Data”, “Edit Data Graphic”. Now you can change for example the icon set as shown in Figure 9. It is possible to choose the default Operations Manager icon set or for instance traffic lights.
Figure 9. Edit the icon set for the health state of an object.
Adding refresh state
To ensure that the dashboard will continuously refresh its data, a state of the refresh time can be added to your dashboard. To do this, go to the Operations Manager ribbon (see Figure 1) and click on the ”Add Status” button. Now you will see that the refresh time of the dashboard is displayed on the drawing as presented in Figure 10.
 Figure 10. Adding the state of the refresh time to the dashboard.
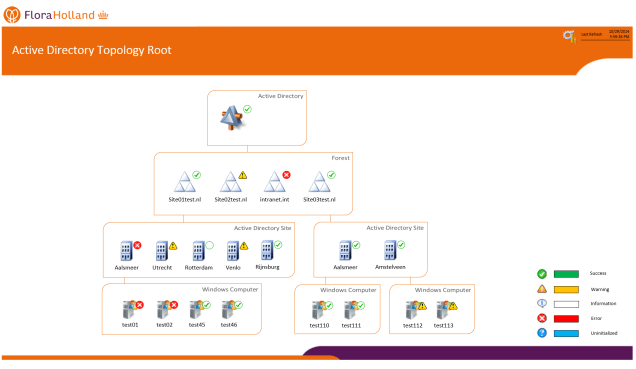
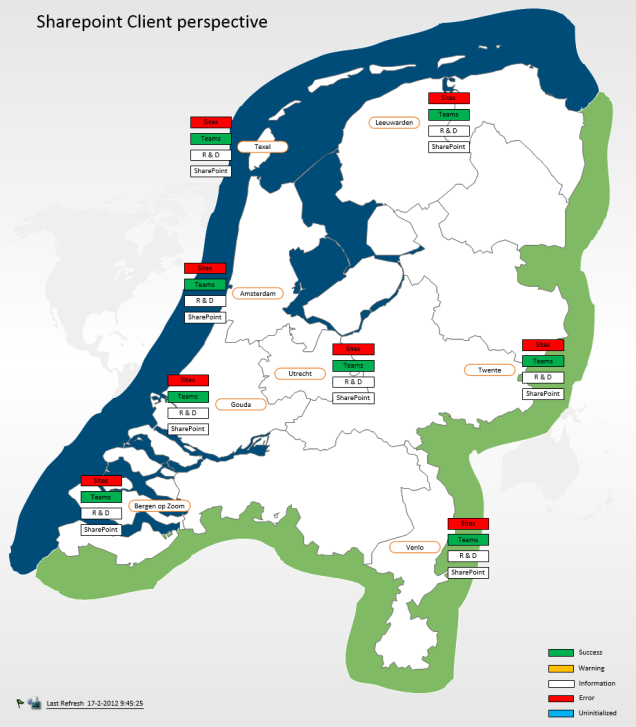
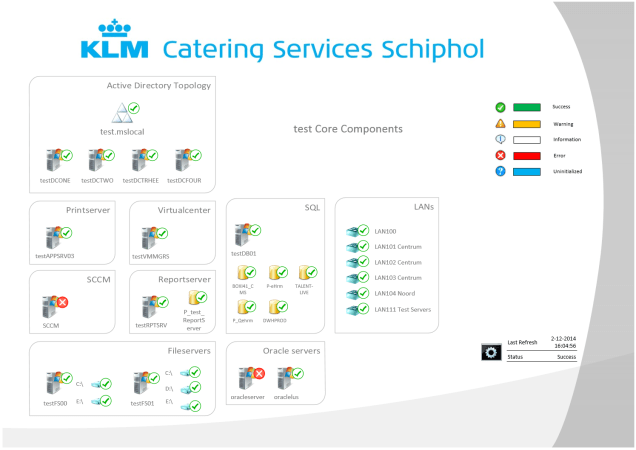
Below some examples of dashboards that I created using the Microsoft Visio Add-in are provided.
Resources
You can download the Operations Manager data module for Visio and the SharePoint data provider via the following link: http://www.microsoft.com/en-us/download/details.aspx?displaylang=en&id=29268
Microsoft has documented this Add-in very well, so installing it should not be a problem. Please see the following links for more information about how to install, configure, and use the Visio Add-in and the SharePoint 2010 Visio Services Data Provider.
- Install the Visio 2010 Add-in
- Install the Visio Services Data Provider
- Grant Visio Services with Read-Only Operator Permissions
- Configure the Operations Manager Data Source in Visio 2010
- View an Operations Manager Distributed Application Diagram in Visio 2010
- Add Links to Operations Manager to a New or Existing Visio 2010 Document
- Build a simple monitoring dashboard using the Visio Web Part
- Publish a Visio diagram to SharePoint 2010
- Change the Way Health State is Represented in Visio 2010
- Troubleshooting the Visio 2010 Add-in
Source: https://technet.microsoft.com/en-us/library/hh920821.aspx
OpsLogix ProView
The ProView solution made by OpsLogix is also an amazing tool to create dashboards. ProView is also an addition to Visio. This means that Visio is required to be used for building dashboards for Operations Manager.
ProView can minimally do the same thing as the Microsoft Visio Add-in. Thus, adding your own stencils and using these shapes is not an issue. ProView stands out with the ability to let you use performance counters. This means that you can get real-time insight in the performance of objects from Operations Manager such as databases, computers etc. Another very cool feature is that ProView dashboards are based on HTML 5, so you have the opportunity access the dashboards on any device. Therefore, it is not required to use SharePoint when publishing the dashboards.
How to create dashboards with Proview?
When ProView is installed, click here for the installation guide, the OpsLogix ProView tab will appear in the ribbon (Figure 11).
Figure 11. The ProView tab in the ribbon in Microsoft Visio.
First we have to configure the connection between ProView and Operations Manager as shown in Figure 12. Fill out the requested information and test the connection when you have done this click “Apply and Close”.
Figure 12. Configure the connection between ProView and Operations Manager.
If you intend to display the drawing on an HD screen you can directly adjust the size of the drawing with a press of a button to a 1080p format. To do this select “Set Size HD” in the ribbon (Figure 11).
Adding objects to the drawing
For ProView also applies that after the connection with Operations Manager has been made you can start creating dashboards. Just like the Visio Add-in from Microsoft you can add with ProView also different objects to the drawing. ProView allows you to use Alerts Counters, Health States, Performance Counters and Monitoring Add States objects. I will describe the features and basic usage of each of them.
Alert Counters
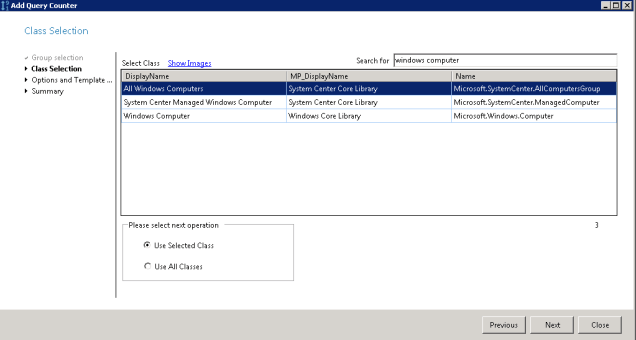
Alert counters can be used to get insight in the amount of alerts. With the “Add Counter” button you have the option to display all open alerts of a group. In this example we want to see all open alerts from the Windows Computer group. To accomplish this, select the first group as shown in Figure 13, and subsequently select the right Windows Computer class (Figure 14).
Figure 13. Group Selection, Select Group.
Figure 14. Class Selection, Select Class.
In the “Options and Template Management” screen, you can select an alert template as shown in Figure 15. There are many different flavors to choose from, for example “Show all active Critical Alerts” or “Show all Unhealthy Targets from SCOM”. By choosing an alert template it is possible to adjust the thresholds for the error and healthy state. Subsequently, it is possible to modify the colors of the health state (Figure 16), click “Next” and press “Add”.
Figure 15. Options and Template Management, Choose Template.
Figure 16. Options and Template Management, Pick the health state color.
Now the Alert Counter has been added to the Visio drawing (Figure 17). Selecting the Live Preview button in the ribbon as shown in Figure 11, you will get a preview of the dashboard including real time information from Operations Manager.
Figure 17. Adding Alert Counter on Visio drawing.
Health States
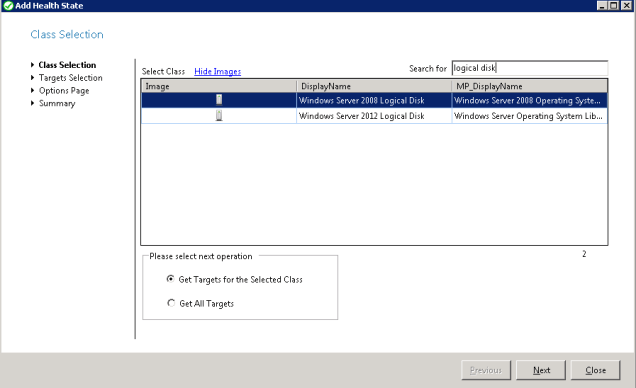
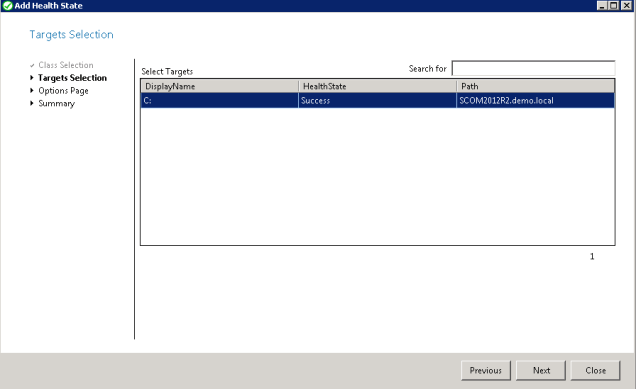
Health states can be used to gain more understanding of the health from particular objects. When you click on the “Add Health State” button in the ribbon (Figure 11) you have the option to add health states of objects. In the example presented logical disks were selected (Figure 18). On the “Target Selection” page select the instance you want to display (Figure 19).
Figure 18. Class selection, Select Class.
Figure 19. Target selection, Select Target.
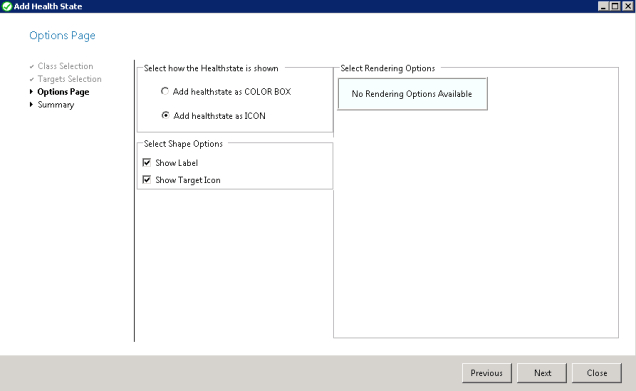
On the “Options Page” you can select how you want to display the health state (Figure 20). You can choose between 1) an icon that will change its color and 2) the icon with a health state in the right corner. Click “Next” and press “Add” on the summary page, now the object will appear on the dashboard (Figure 21).
Figure 20. Options Page, Select how the health state is shown.
Figure 21. Logical Disk object with health state icon.
Performance Counters
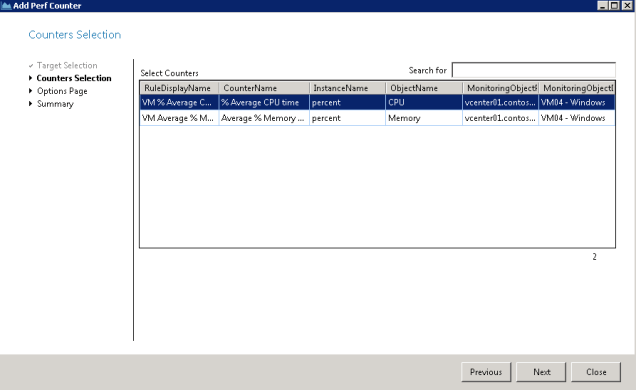
The use performance counters will give you more insight in the performance of the selected object trough dynamic data graphics. To add performance counters to the dashboard use the “Add PerfCounter” button in the ribbon as presented in Figure 11. On the first page of the wizard, entitled “Target Selection”, you can select an instance (Figure 22). On the next page you can select the performance counter of preference (Figure 23).
Figure 22. Target Selection, Select Target.
Figure 23. Counter Selection, Select Counters.
Click “Next” to go to the options page. On this page (Figure 24) you can configure several items like which data graphic you want to use and how you want to render. There are different Graphic Types such as Line, Sparkline, Bar, Bullet, Pie and Zoomline to choose from.
Select “All Targets” if you want to include also the performance counter data from all other targets of the same target class you selected before. Otherwise choose “All Instances” when you want to include the performance counter data from all the instances that belong to the selected target. In this example I want to see the average CPU time of one target, so I leave both options unselected. Define all remaining settings and press “Next”, then press “Add” to add the performance counter to the drawing (Figure 25).
Figure 24. Options Page, Select Properties.
Figure 25. Adding Performance Counter to the Visio drawing.
Add Monitoring State
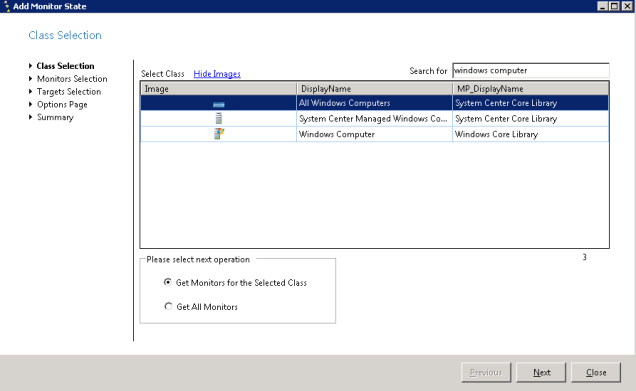
Through this wizard you can add the health state of a monitor to the dashboard. The health state gives insight in the different monitors that are configured in Operations Manager. This is very useful in case you want to see the availability of the defragmentation state instead of the whole disk. Click on the “Add Monitor State” button in the ribbon (Figure 11). In the add monitor state wizard select the class you want to use. In the present example I choose the Windows Computer class (Figure 26).
Figure 26. Class Selection, Select Class.
On the Monitor Selection page select the correct monitor and click “Next” (Figure 27).
Figure 27. Monitors Selection, Select Monitors.
Subsequently, select the target you want to use as demonstrated in Figure 28.
Figure 28. Target Selection, Select Targets.
On the option page you can choose for a health state as a color box or icon. In this example I choose the color box (Figure 29). On the summary page click “Add” to add the monitor to the dashboard (Figure 30).
Figure 29. Options Page, Select how the health state is shown.
Figure 30. Add Monitor State as a color box to the drawing.
Dashboard Preview
Unlike the Microsoft Visio Add-in, ProView does not have the ability to display live data on the dashboard at the moment you are working on it. To see the live data from the dashboard press the “Live PreView” button in the ribbon (Figure 11).
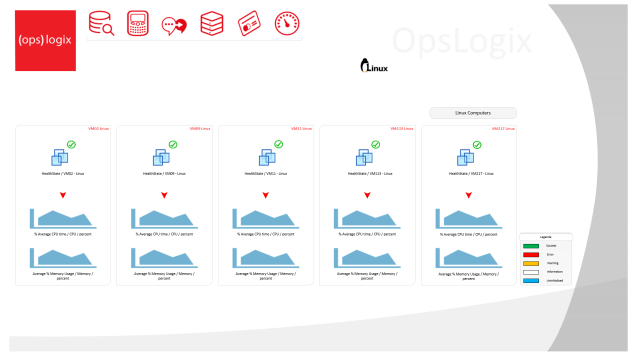
Below some examples are presented of dashboards that I created using OpsLogix Proview.
Resources
For more information about the OpsLogix Proview Visio plug-in please see: http://www.opslogix.com/proview/
OpsLogix made some nice getting started videos. Please see the following links for more information about how to install, configure, and use ProView.
- This video will show you how to get started with the Proview authoring Plugin: http://www.opslogix.com/opslogix-proview-getting-started-video/
- This video will show you how to use the “Add Counter” Wizard in the Proview authoring Plugin: http://www.opslogix.com/opslogix-proview-add-counter-wizard/
Conclusion
Both Visio solutions described in this blog post can be used to create fantastic dashboards for Operations Manager! However, each Visio solution has its own advantages and disadvantages.
The possibilities with the Microsoft Visio Add-in are almost endless. An advantage is that the Microsoft Visio Add-in is free of cost. One of the drawbacks is that the Microsoft Visio Add-in does not support HTML 5 and this is where ProView stands out. Resulting from the fact that ProView is HTML 5 based and the dashboards can be accessed from different locations and devices. ProView allows you to create dashboards in Visio and store these in a management pack, so the dashboards are also visible in the Operations Console. Additionally, when using ProView it is possible to add performance counters of objects to the drawing, so it provides insight in the performance of the managed objects.
ProView also works via a wizard that can be used to add and edit the image or icon of grouped/individual counters including perfmon, health and/or monitor states. Publishing the dashboards in ProView does not require SharePoint or Silverlight. The Microsoft Add-in needs SharePoint if the dashboards will be published on a central location.
Despite the disadvantage of not supporting HTML 5, the Microsoft Visio Add-in is very easy to install and use especially if you use the Visio stencils available for Operations Manager. In fact, the installation of the Microsoft Visio Add-in is less complex compared to that of OpsLogix ProView. Of course it should be noted that the dashboards created in ProView cannot only be published using Visio or SharePoint but also from the Operations Manager console which is considered an advantage over Microsoft Visio Add-in. For this reason the installation of ProView is more complex and consequently also more time consuming.
Microsoft Visio Add-in offers the opportunity to link multiple tabs in the same Visio file. This is especially very convenient when one wants to zoom in on an object presented on the dashboard. ProView offers approximately the same functionalities. However, resulting from the use of *.svg as a file extension every tab should be saved as a separate file in ProView.
It is difficult to indicate which of the two Visio solutions I prefer since both solutions make it possible to create excellent dashboards. The use of both solutions of course requires some knowledge on Visio. Considering that the Microsoft Visio Add-in is free of charge and that it can easily be installed and used, I slightly prefer this Visio solution. To be honest ProView has just entered the world of Operations Manager dashboarding, so I expect that many more cool features will be added in the future. ProView is certainly a product to keep an eye on.
Be Creative
In this blogpost I describe the basics of both the Microsoft Add-in and Oplogix Proview. As it is expressed beautifully on the OpsLogix website:
“You are the artist and you can control everything”
Thus, apply your own creativity when making overview dashboards of the infrastructure or the application environment of organizations. I hope I have provided an insight in the possibilities of both Visio solutions and that it will inspire you to start with one of these fantastic products. Please also see the webinar from Pete Zeger on dashboarding in System Center were some of my dashboards are shown: https://www.youtube.com/watch?v=NuMAUKEDkx0&feature=youtu.be

