Introduction
The last couple of weeks I was working for a customer to configure .NET Application Performance Monitoring (APM). One of the applications that they want to monitor is SharePoint 2010. In this blog post I will guide you through the configuration steps. Although this post is focused on SharePoint 2010, the Server Side configuration steps can also be used for configuring other .NET applications. The reason that the focus lies on the Server-Side configuration rather than the Client-Side configuration, is that for SharePoint 2010 Client-Side monitoring is not supported. Below I describe these issues and my findings.
The prerequisites
Firstly, it needs to be checked if AviCode is still available on the servers that need to be configured. It is not possible to have both AviCode and APM Agents on the same IIS server. Thus, in case an AviCode agent is installed, please remove the AviCode agent prior to starting the APM configuration. For more information see https://technet.microsoft.com/en-us/library/hh543998.aspx
Secondly, it needs to be checked if the correct Management Packs (MP) are installed in Operations Manager. Figure 1 presents the MP’s that need to be imported in order to avoid warnings during the configuration of APM.
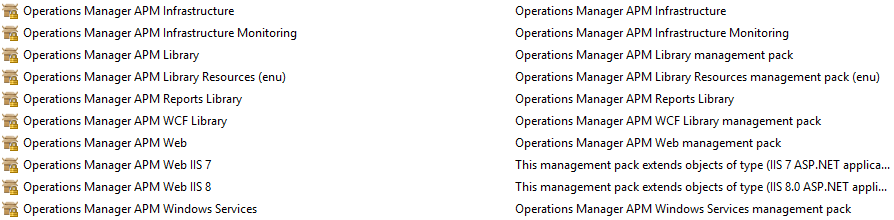
Figure 1. Required Management Packs for APM
Configuration Server-Side
When opening the Operations Manager console go to Authoring → Add Monitoring Wizard. In the “Monitoring Type” screen select .Net Application Performance Monitoring (Figure 2) and click Next.
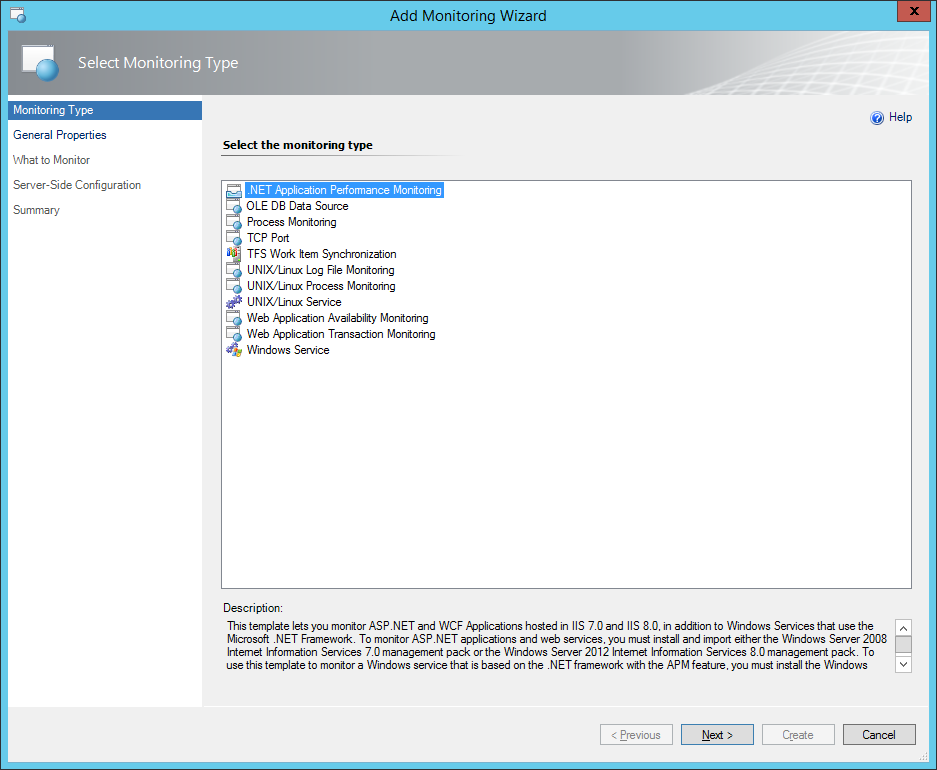
Figure 2. Monitoring Type, APM configuration wizard.
Figure 3 gives an overview of the general properties in the APM configuration wizard. Here it is possible to fill in the application name. In this case the name “SharePoint 2010” was used. Next, the destination of the MP can be selected. It is recommended to save your APM configuration in a new MP. Click Next to continue.

Figure 3. General Properties, APM configuration wizard.
In the “What To Monitor” screen that will appear it is possible to select the application components. This can be done by clicking the Add… button (Figure 4).
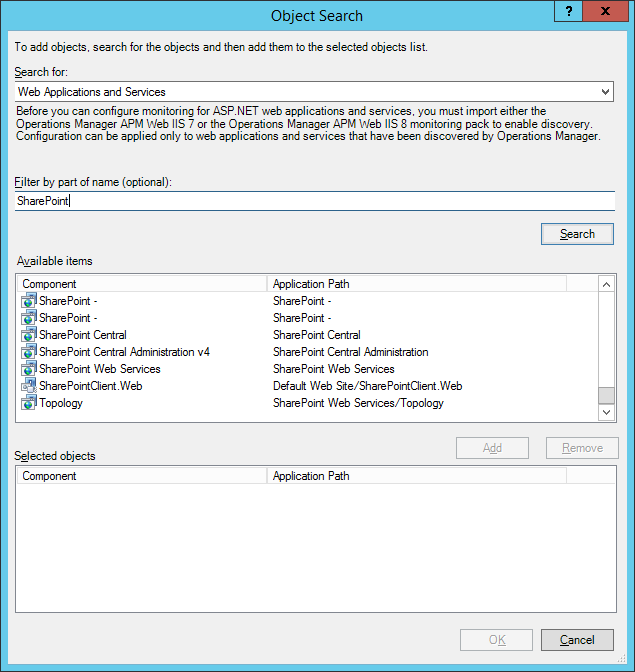
Figure 4. Object Search window, APM configuration wizard.
Once the selected application components are added click OK. The “What To Monitor” screen also provides the ability to select the environment, in our case this is Production. Subsequently, a group can be selected with our SharePoint 2010 production servers as the Targeted group (Figure 5).
*The environment name will be displayed behind the application name with a dash. So the name in our case will be “SharePoint 2010 – Production”.
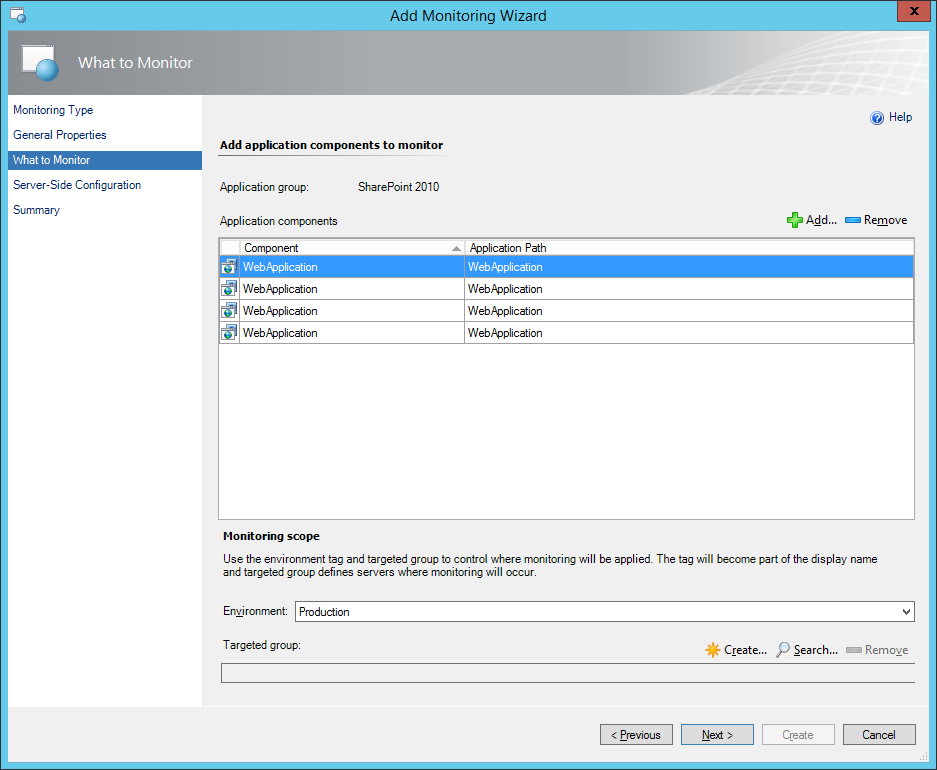
Figure 5. What to Monitor window, APM configuration wizard.
In the Server-Side Configuration window it is possible to select event alerts (Figure 6). In the present case both performance and exception alerts are selected. The performance threshold were kept on default (i.e. 15 seconds).

Figure 6. Server-Side Configuration window, APM configuration wizard.
If preferred, one can select the Advanced Settings enabling a more in dept configuration of the events (Figure 7). For example, the threshold can be tuned. This can also be done for performance events when the maximum number of events exceeds the threshold including the interval in seconds, minutes and hours. An average request time threshold can also be set. In addition to this configuration it is also possible to select the alerts one wants to see (e.g. security, connectivity and application failure alerts). Once these settings are complete, click OK, then Next and Create.

Figure 7. Advanced settings Configuration window, APM configuration wizard.
*Please note that for APM an IIS restart is required in order to function properly.
Checking if APM works
Just to be sure it can be checked if the System Center Management APM service has started correctly on the related servers. If everything is configured properly, this service will start automatically (Figure 8).

Figure 8. Services. MSc on the server, to check if the System Center Management APM service has been started.
Now the Operations Manager console needs to be checked to determine if the correct data is presented. For this purpose, go to the Monitoring Pane and open the folder Application Monitoring → .Net Monitoring and in the current case → SharePoint 2010 – Production. The State View can now be selected (Figure 9). Moreover, some incoming alerts can even been seen as presented in Figure 10.
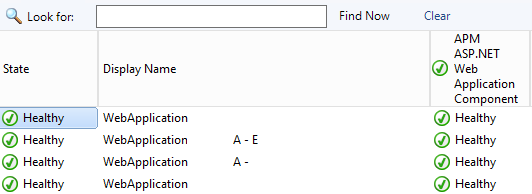
Figure 9. State view APM ASP.NET Web Application Component.

Figure 10. Alert view APM ASP.NET Web Application Component.
Configuration Client-Side
*Please note that the configuration of client-side as described below was found to give disappointing results. I will configure client-side-monitoring for other IIS applications in another post.
Before configuring the client side monitoring for SharePoint 2010, a check needs to be performed to determine if the application is ready for this functionality. We can monitor the end-user experience with this feature. First the task needs to be run to check the compatibility of the website. This task can be run from the IIS 7.0 ASP.NET Web Application Inventory or IIS 7.0 ASP.NET Web Application Inventory when an II 8.0 website is concerned (Figure 11 and 12).
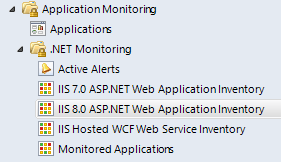
Figure 11. IIS 7.0 and 8.0 ASP.NET Web Application Inventory view.

Figure 12. Task to check whet either the IIS application is ready for client-side monitoring.
Next, click Run to start the actual compatibility check and wait for the results (Figure 13).
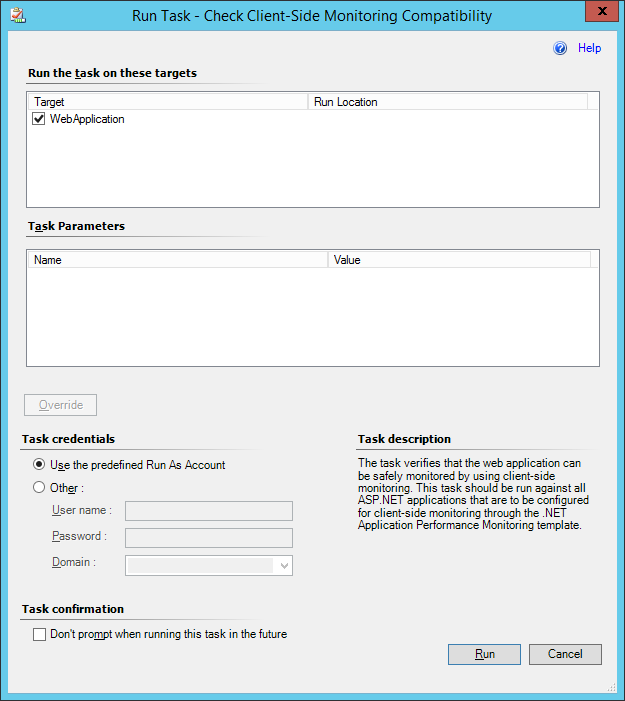
Figure 13. Task to check whet either the IIS application is ready for client-side monitoring.
Unfortunetly, the output for the SharePoint client side compatibility test, were as follows:
Compatibility check result: Critical incompatibility. Severe incompatibilities were found in application files.
Taking a closer look at the incompatibility resources, it seemed that a lot of errors were related to default SharePoint files. The complete output was over 39 pages. Below some errors that were obtained are presented (Figure 14).

Figure 14. Output client-side monitoring compatibility task.
.dll assembly file: C:\Program Files\Common Files\Microsoft Shared\Web Server Extensions\14\isapi\Microsoft.Office.Server.dll – Method reference name: Flush. .dll assembly file: C:\Program Files\Common Files\Microsoft Shared\Web Server Extensions\14\isapi\Microsoft.SharePoint.dll – Method reference name: Flush. .dll assembly file: C:\Program Files\Common Files\Microsoft Shared\Web Server Extensions\14\isapi\microsoft.sharepoint.portal.dll – Method reference name: Flush.
.aspx file: C:\Program Files\Common Files\Microsoft Shared\Web Server Extensions\14\template\layouts\sledit.aspx – Line: 113, Character: 1. .aspx file: C:\Program Files\Common Files\Microsoft Shared\Web Server Extensions\14\template\layouts\slnew.aspx – Line: 90, Character: 1. .aspx file: C:\Program Files\Common Files\Microsoft Shared\Web Server Extensions\14\template\layouts\viewedit.aspx – Line: 602, Character: 1. .ascx file: C:\Program Files\Common Files\Microsoft Shared\Web Server Extensions\14\template\controltemplates\sldlibtemplates.ascx – Line: 88, Character: 1.
.dll assembly file: C:\Program Files\Common Files\Microsoft Shared\Web Server Extensions\14\isapi\Microsoft.SharePoint.dll – Method reference name: WriteSubstitution. .dll assembly file: C:\Program Files\Common Files\Microsoft Shared\Web Server Extensions\14\isapi\Microsoft.SharePoint.dll – Method reference name: .ctor.
Because there were a lot of incompatibility errors with SharePoint’s default dll’s,Microsoft was asked to take a look at this and comment on our findings. Microsoft came back with the following answer:
Client-side.NET Application Performance Monitoring (APM) is not supported for SharePoint. Enabling client-side .NET Application Performance Monitoring for SharePoint can result in unpredictable application behavior and failures.
https://technet.microsoft.com/en-us/library/jj614617.aspx
It seems to be that Microsoft does not support Client-Side Monitoring for SharePoint 2010 in Operations Manager 2012 SP1 and Operations Manager 2012 R2 at all.
Additionally, Microsoft also indicated that they do not support SharePoint 2013 for Application Performance Monitoring. Moreover, they also indicated that there are no plans for now to make this happen in the (near) future, so that’s pity…
In the end we can still make use of Web Application Transaction monitoring and Web Applications Availability Monitoring. However, it does not provide the end-user experience and troubleshooting possibilities that we want from client-side monitoring.
I will write another post soon about client side monitoring that works without SharePoint! In that post I will also describe how you can check that it actually works!

Nicely done!
Thank you Coen. All your help is much appreciated!